BTC Technical Analysis: Key Indicators to Follow
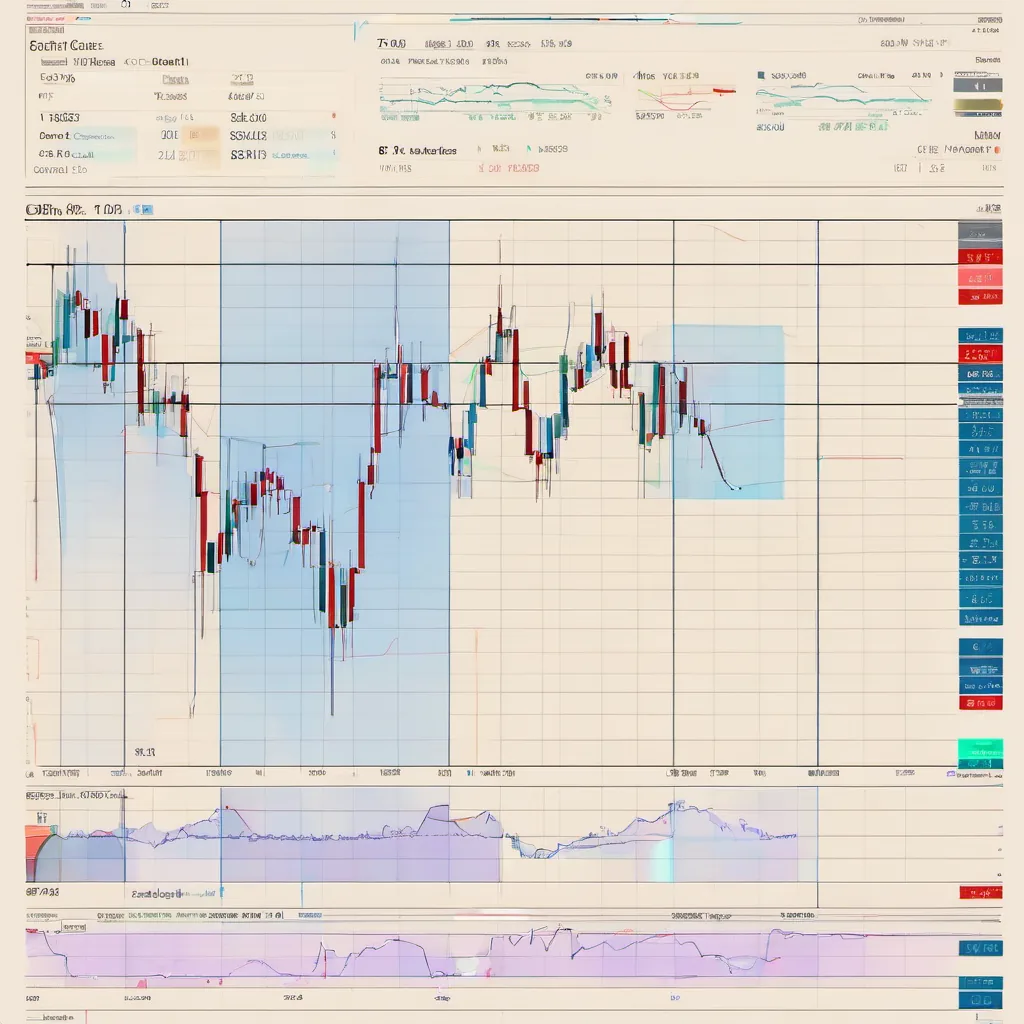
Trend Identification with Moving Averages
Moving averages (MAs) are essential tools for identifying trends in Bitcoin (BTC) price movements. By smoothing out price data over a specified period, they help traders gauge the overall market direction. Among these, the 50-day and 200-day moving averages are particularly significant in the cryptocurrency market.
Golden Cross and Death Cross
A golden cross occurs when the 50-day MA crosses above the 200-day MA. This event is widely seen as a bullish signal, indicating that BTC could be entering a strong upward trend. Conversely, a death cross, where the 50-day MA crosses below the 200-day MA, can signal a bearish trend. These crossovers provide critical insights for traders looking to capitalize on potential market shifts.
Importance of the 200-Day MA
The 200-day moving average is a widely watched indicator in the crypto space. Historically, BTC staying above the 200-day MA signals a bullish trend. For instance, in late 2020, BTC maintained its position above this critical level, contributing to the massive price surge that followed. Understanding the significance of the 200-day MA can help traders make more informed decisions regarding their positions.
Momentum Analysis with RSI and MACD
Momentum indicators like the Relative Strength Index (RSI) and the Moving Average Convergence Divergence (MACD) are crucial for assessing the strength of price movements. These tools not only provide insights into current trends but also help anticipate future price actions.
Evaluating Overbought and Oversold Conditions with RSI
The RSI measures the magnitude of recent price changes on a scale from 0 to 100. Readings above 70 suggest that Bitcoin is overbought, while values below 30 indicate oversold conditions. Historically, RSI values above 70 have often preceded price corrections. For example, in early 2021, BTC's RSI hit levels above 70 before experiencing a notable pullback. This understanding of RSI can guide traders in timing their trades effectively.
Analyzing MACD for Trend Changes
The MACD is a trend-following momentum indicator that shows the relationship between two moving averages of prices. A bullish signal occurs when the MACD line crosses above the signal line, suggesting upward momentum. Conversely, a bearish crossover signals potential downward movement. Strong MACD crossovers, particularly on the daily chart, can indicate significant trend changes. A notable example occurred in October 2020, when a strong bullish crossover signaled the beginning of a new upward trend. Recognizing these signals can enhance traders' ability to navigate market fluctuations.
Key Price Levels and Volume Confirmation
Support and resistance levels are critical for traders looking to make informed decisions about entry and exit points. Understanding these levels, along with volume trends, can provide valuable insights into market dynamics and enhance trading strategies.
Identifying Support and Resistance with Fibonacci Levels
Fibonacci retracement levels are a popular tool for identifying potential support and resistance levels. These levels, calculated using Fibonacci ratios such as 23.6%, 38.2%, 50%, 61.8%, and 78.6%, can highlight significant price points. During the May 2021 BTC crash, the price found support near the 0.618 Fibonacci level, illustrating the effectiveness of this technique. By incorporating Fibonacci levels into their analysis, traders can better anticipate price movements.
Volume as a Trend Strength Indicator
Volume analysis is crucial for confirming the strength of a trend. Rising prices accompanied by increasing volume suggest a strong bullish trend, while declining volume during a rally may indicate weakness. A prime example of this occurred in Q4 2020, when high trading volume coincided with a surge in BTC price, confirming the strength of the bull market. Understanding the relationship between volume and price can empower traders to make more strategic decisions.
FAQ
What is a moving average?
A moving average is a statistical calculation that smooths out price data by creating a constantly updated average price. It is commonly used to identify trends over a specific period.
What does an RSI above 70 indicate?
An RSI reading above 70 suggests that an asset is overbought, meaning it may be due for a price correction. This is often a signal for traders to consider selling or taking profits.
How can Fibonacci retracement levels be used?
Fibonacci retracement levels are used to identify potential support and resistance levels based on the Fibonacci sequence. Traders often look for price reversals at these levels to make trading decisions.
What is a MACD crossover?
A MACD crossover occurs when the MACD line (the difference between two moving averages) crosses above or below the signal line (the average of the MACD line). This can indicate a potential change in trend direction.
Why is volume important in trading?
Volume indicates the strength of a price movement. High volume during price advances suggests strong buying interest, while low volume may indicate a lack of conviction in the price movement.
Related articles

Effective Trading Strategies for Cryptocurrency
Explore effective trading strategies for cryptocurrency, including technical and fundamental analysis, risk management techniques, and more. Learn how to navigate the volatile crypto market and enhance your trading performance.

BTC Price Analysis: Short-term and Long-term Trends
Bitcoin's price is influenced by various factors, including macroeconomic conditions and market trends. This article explores both short-term volatility and long-term trends affecting BTC prices.

Technical Analysis of Bitcoin: Q4 2023
In Q4 2023, Bitcoin's price surged from $27,000 to approximately $44,000, driven by ETF approval anticipation. Key technical indicators such as RSI and MACD, along with strong on-chain data, reinforced the bullish sentiment.